I made a bus map.
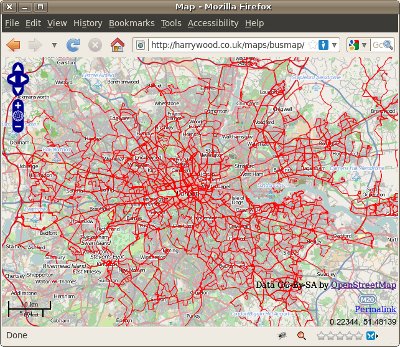
Not just an image, but a dynamic “slippy map” rendered at several zoom levels.
This was my “hack” for the RewiredState, National Hack the Government Day”, a gathering of hackers who build something in a day, with the aim of tackling government/society problems, working with government data. Projects are presented at the end of the day.
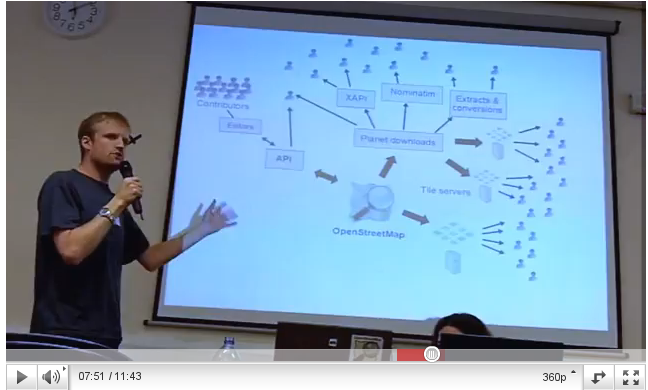
I created the bus map by “rendering” OpenStreetMap data. By this I mean starting from raw map data, the underlying vector data, the coordinates and connections of every road etc, and creating raster images arranged in tiles at several zoom levels, for the map display linked above.
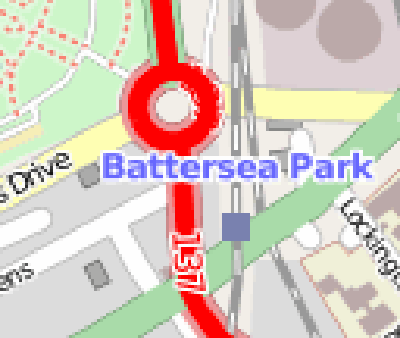
Clearly within the graphics routines this bright red routes data is drawn in a particular order, and in a sense it is laid on top of the map, but it’s important to realise the routes are baked into the raster images. This isn’t a javascript overlay. Rendering data in this way has advantages and disadvantages over javascript overlays. An advantage is that we can show all the bus routes of London when zoomed out, without crashing the browser. Other advantages are in the subtleties of how you can make the map look. I haven’t really demonstrated this very well here yet, but I hope to make some improvements. If you look closely some tube station labels are drawn over the routes, which at least shows it’s not an overlay. There are other (better) OpenStreetMap rendering examples elsewhere
Getting the data
You can download raw OpenStreetMap vector data for the entire planet. In fact I took an england extract in PBF format offered up by geofabrik. From this I just chopped out the London area (this bounding box) using the tool “osmosis” with this command:
wget http://download.geofabrik.de/osm/europe/great_britain/england.osm.pbf

$OSMOSIS_HOME/bin/osmosis \
   --read-pbf ./england.osm.pbf \
   --bounding-box left=-0.543 right=0.337 top=51.719 bottom=51.253 idTrackerType=BitSet \
   --write-xml ./london.osm
Once I had london.osm, it was time to put this through the Mapnik rendering tool. Very broadly the steps were:
- Install Mapnik. In fact this is several steps, but happily I already had it installed. The ‘Build your own OpenStreetMap Server’ tutorial by Richard Weait was useful for this
- Load the data into postGIS with a command such as
./osm2pgsql -S default.style --slim -d gis ./london.osm
- Edited ‘generate_image.py’ to render a single image in central london as a test
- Edit ‘generate_tiles.py’ to specify the london bounding box and zoom levels. Initially I’ve rendered zoom levels 7 to 15.
- Run ‘generate_tiles.py’ to create the tileset (png files in a directory structure)
- Made a HTML file with the javascript to launch OpenLayers fullscreen pointing at these tiles (do ‘view source’ on the site to see the javascript for this)
- Copied the stylesheet file ‘inc/layer-ferry-routes.xml.inc’ to make a new style layer for bus route relations (thanks to SK53 for suggesting this)
- Reference the new layer in osm.xml, and ‘inc/layers.xml.inc’
- Test using ‘generate_image.py’ before re-running ‘generate_tiles.py’ to re-render the tiles.
- Added more rules for varying thicknesses and a TextSymbolizer for showing route labels
My busmap stylesheet so far: style.tar.gz
öpnvkarte
Among the list of rendering examples linked above, is the one called “öpnvkarte.de” which shows bus routes throughout europe. In fact this is one of the best examples of customised OpenStreetMap rendering. Really nice colour and style choices with subdued colours for the background features enhancing the bold transport lines very clearly. So bus route rendering has certainly already been done. What’s the point in my map then?
öpnvkarte is very german. It’s named after a german transport network. The map is quite literally centred on Germany, and you’ll have noticed it has an un-typeable german character in it’s URL (although Shaun has provided openbusmap.org as a more sensibly named proxy). Petty irritations perhaps. So what else?
As far as I’m aware öpnvkarte hasn’t been updated in a while, so by re-rendering today’s openstreetmap data, we can see how the community has progressed with adding more routes. I was slightly disappointed to find that there wasn’t much difference in London actually. Just one or two details. Compare here with here. But OpenStreetMap people tend to be motivated a lot by renderings and other uses of the data they’re gathering. If the bus map stops being updated, then people stop adding bus routes.
There are other things which are less than perfect about öpnvkarte. It’s not a worldwide rendered tileset. It went worldwide for a few weeks but the server didn’t manage to cope. (I know my map is obviously not competing very well. I just rendered tiles for London!)
Wordwide tile rendering and re-rendering of updates, are tricky technical challenges. Obviously the developer of öpnvkarte is under no obligation to do these things, it’s just a shame that he doesn’t. More of a shame is that he doesn’t (as far as I’m aware) share his stylesheet config files. Again he’s not obliged to do so, and given the amount of work he must have put into it, perhaps it’s understandable. But sharing stylesheets would allow people with hardware and tuning know-how to have a go at tackling these other hosting challenges.
So those are a few weak justifications for starting all over again and attempting to build a different bus map stylesheet. My mapnik config files are hopelessly rudimentary so far, but it’s a start. Mostly though, this is just another baby step in my slow climb up the Mapnik learning curve. I wrote a diary entries back in January about this, but until this weekend I hadn’t tried anything further.
RewiredState
It was good to get up and present this rendering idea at rewiredstate, to a bunch of hackers and data mashers who I think would find this sort of thing interesting to play with themselves. I know a lot of them will reach for the boring old google maps toolsets for their map mashing work, but hopefully I gave a hint at some of the raw power and rendering fun offered by OpenStreetMap. Perhaps I should have made this important point again though: You can just use the familiar google maps javascript API on top of OpenStreetMap basemaps!.
The important point I did remember to make in my 2 minute slot: Next weekend we’re having a London OpenStreetMap hack weekend. I must try to prepare this time!
Thanks to the hard working RewiredState organisers and their sponsors (wired uk, tso, dxw) for a great day, and for all the free penguin biscuits and beers in the pub afterwards.
UPDATE: New transport map from Andy Allan. My friend Andy is creator of OpenCycleMap and all round Mapnikmeister. Unveiled today (14th April), his transport map is auto-updated and rendered worldwide (how are your local buses looking?) with beautiful pale shaded background cartographic choices. I think we can safely say I’ve been outdone on this one 🙂