I was at the OpenStreetMap conference State Of The Map EU in Dundee a couple of weeks ago. Lots of fun! Right at the end of the schedule, I gave a talk all about “OpenStreetMap Notes”.
My talk was an introduction to OpenStreetMap, which is something I haven’t done in a while. And I also went into more detail on the different ways of contributing, from complicated things like JOSM, right down to the very simple OpenStreetMap Notes.
Space4 is a new funky little tech hub place, of which London has many, but exciting for me because it’s half a mile from where I live! It’s nice to see Finsbury Park attaining this badge of trendiness, but also it’s super convenient. I can even cheekily duck out of family commitments to attend an event for an hour as I did on this occasion, although it was I shame I didn’t get to stick around and chat to anyone. I did get to answer questions, and it seemed like an interesting audience. I’ll have to try make it along to more events there, perhaps more in this series titled “Mapping for Social and Political Change“.
I’m going to present my introduction to OpenStreetMap and then, in relation to the theme of this evening, I’ll run through some app and gamification ideas and other ways we try to encourage participation in this project.
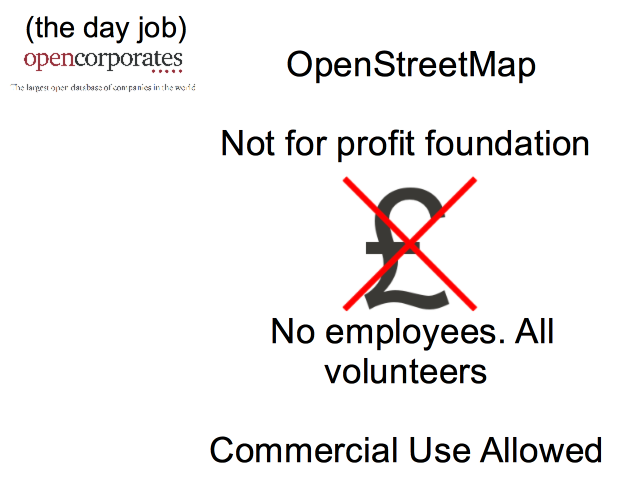
My day job is another interesting open data initiative at a company called OpenCorporates, but that’s a whole other talk! I found this job via my interest in open data and OpenStreetMap actually, but for OpenStreetMap I’m just a spare-time volunteer.
And that’s typical actually. It’s a very volunteer driven initiative. There is a small company called the OpenStreetMap foundation, but there’s only one admin assistant employee. OpenStreetMap is a not-for-profit project with lots of passionate volunteers, although commercial use of the data is allowed, and a number of companies provide services around OpenStreetMap.
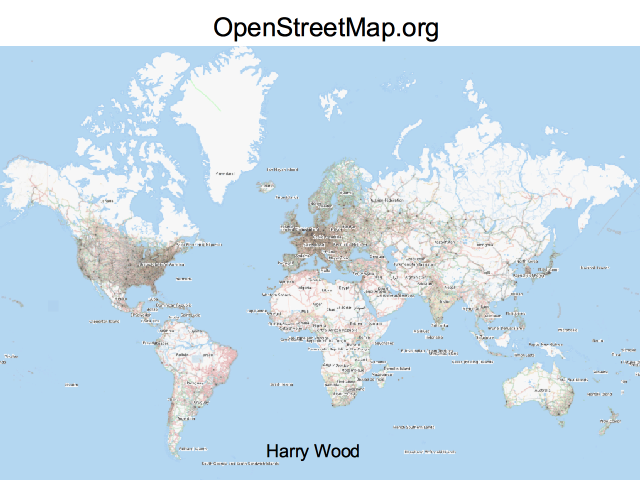
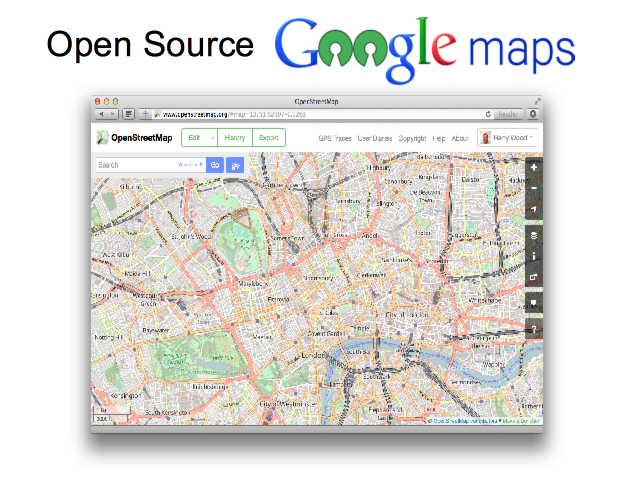
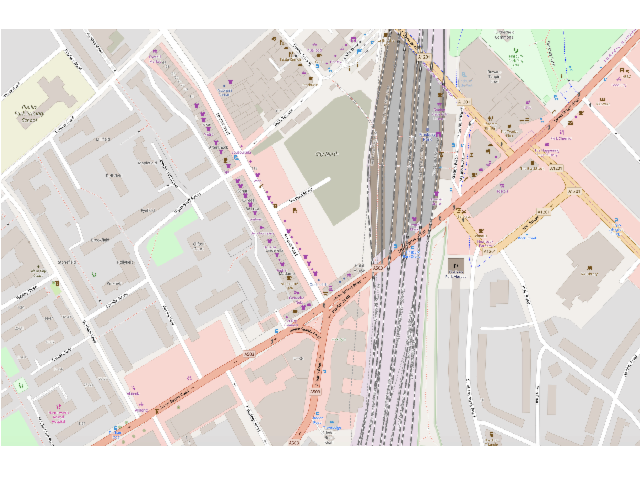
So what is OpenStreetMap? If you’ve only taken a quick look, you’ll perhaps have the idea that OpenStreetMap is a competitor to Google maps. It kind of is that, but that’s really not the whole story.
You only have to zoom in on the map and you’ll start to see that this is a bit different. Here’s where we are at space4. In many areas there’s this kind of very rich detailed data, but you can also get the sense, I think, that this is a very human-crafted map.
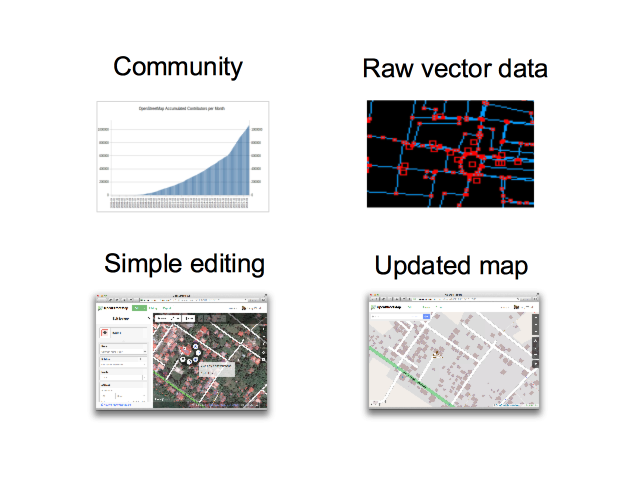
OpenStreetMap is a community of now over 1 million people who have made contributions to the map. It’s a “mass collaboration”, and engaging many people in participation has been the name of the game really.
I’m going to talk more about how we do this, but essentially a key aspect is making the map editing process (which is inherently quite complex) as simple as possible.
The project is called “Open”StreetMap, not just because it is open to edit, but because we release all the data openly licensed as raw vector data. I’ll explain that more, but I think when it comes to community engagement, a key motivator is simply seeing an updated map, taking in the changes people make, and showing a new improved map with a rapid turn-around.
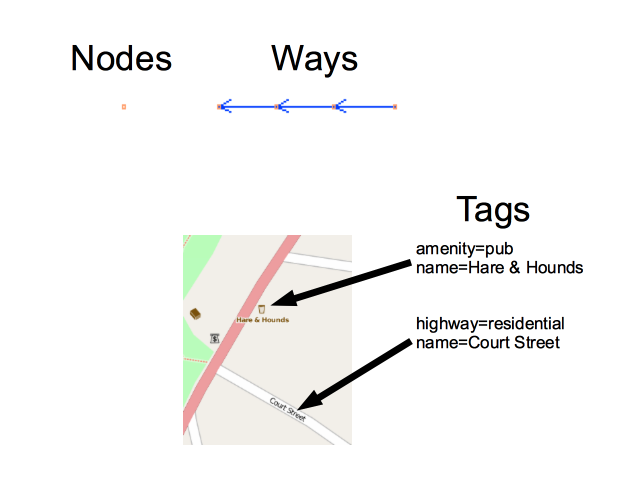
Everything in OpenStreetMap is made up of “nodes” and “ways”. This is what I mean by “vector data”. And then attached this we have “tags”. These name=value pairs.
This is a simple data model, helping drive simplicity of the editors, but particularly with the tags, it’s also very flexible and it means you can put your own ideas into OpenStreetMap for things to be represented on the map. The tags are an interesting aspect of OpenStreetMap’s design which really makes editing simple and fun, even if it means the data is less tidy and usable than it might be. That’s a bias which OpenStreetMap has. A focus on simple fun contributing.
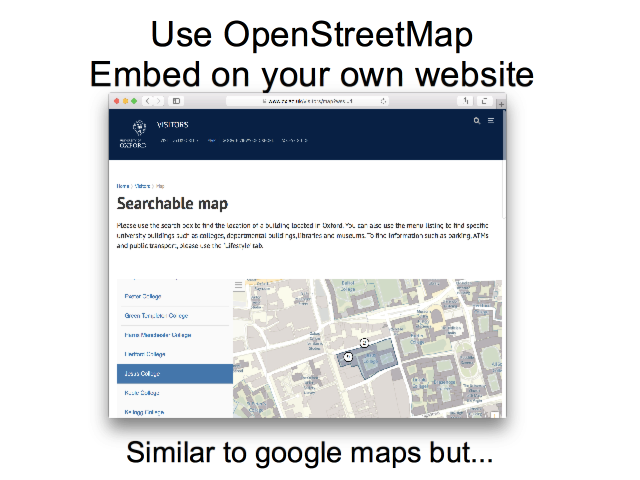
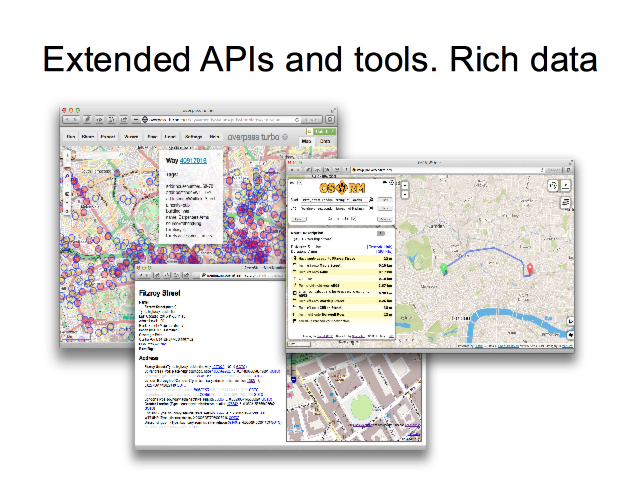
Well you can do the Google maps thing of embedding a map on your website. Also you can build interfaces involving clickable markers etc, with OpenStreetMap as the base-map.
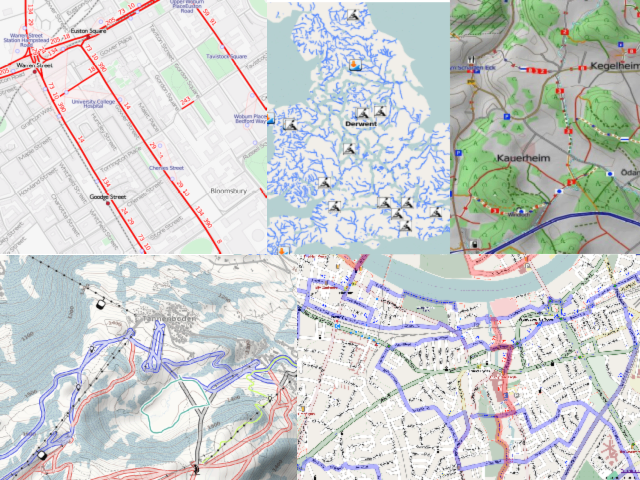
Of course one main use is to have a view of the map. But what kind of view? With access to raw geo-data we can create a customised “rendering” of our map view, choosing different types of data to emphasise and different ways of colouring and styling it.
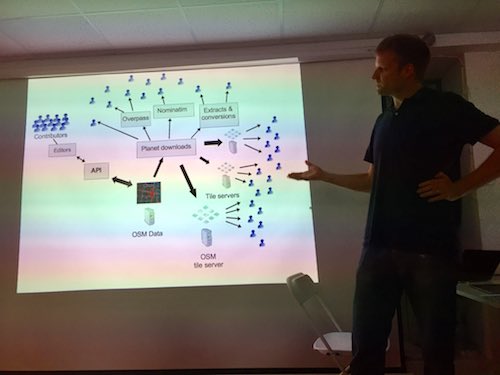
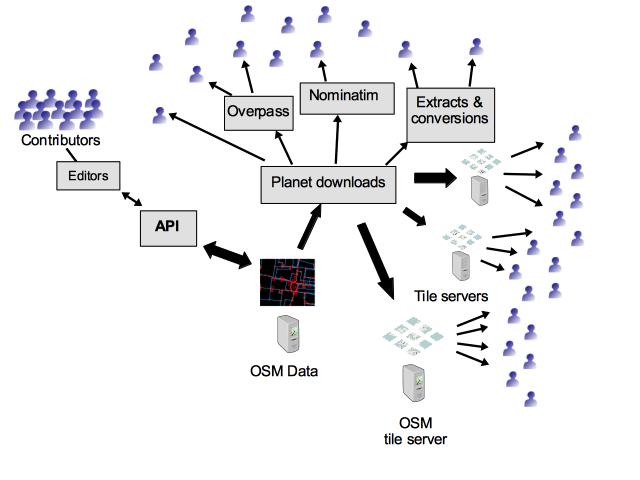
So the raw geo-data flows out from this central OpenStreetMap database, out through an ecosystem of various tools and services which developers are providing and refining (often as open source), out to many many website and mobile apps.
If you’re not a techy developer yourself then this might not seem that exciting, but just think… by contributing to OpenStreetMap you’re not only making a view of a map on openstreetmap.org. The data flows out and gets used in a wonderful variety of different ways.
So I’m going to move on now to talk more about the different ways you can contribute to OpenStreetMap.
I thought I would start with the more complicated ways first, so don’t be put off. I hope to show you that you can contribute in very very simple ways too.
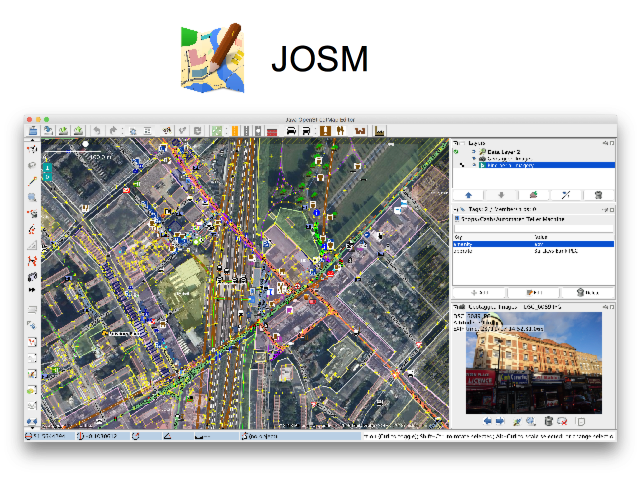
But this is the way I often edit OpenStreetMap. It’s a tool called JOSM. Here we see the photo mapping feature. There’s a photo I took of some shops near here, and little icon here shows roughly where I was when took this.
JOSM is a powerful editor, but actually even if you are just getting started with OpenStreetMap, if you don’t mind learning new software, I recommend diving in and giving JOSM a try, because ultimately it may give the most satisfying editing experience.
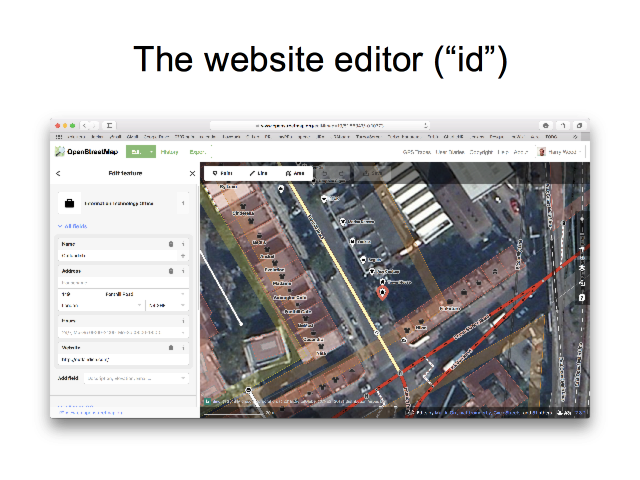
Most people though, will begin by trying the editor on the website. On openstreetmap.org if you click this “edit” button here, you can edit directly with this tool called “id”. No need to install anything.
This is simpler than JOSM, though still quite powerful. It’s easier to get started with.
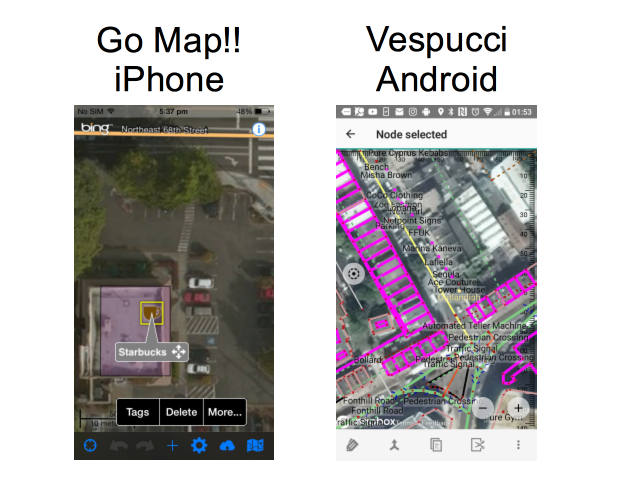
Here’s how you can edit using a smartphone. An app called “Go Map!!” on iPhone and “Vespucci” on android.
These are simplified editing experiences for mobile, however both of these are what I would call “fully featured” OpenStreetMap editors because you can make edits to the “ways” as well as the “nodes” and “tags”. You can edit the geometry of buildings for example.
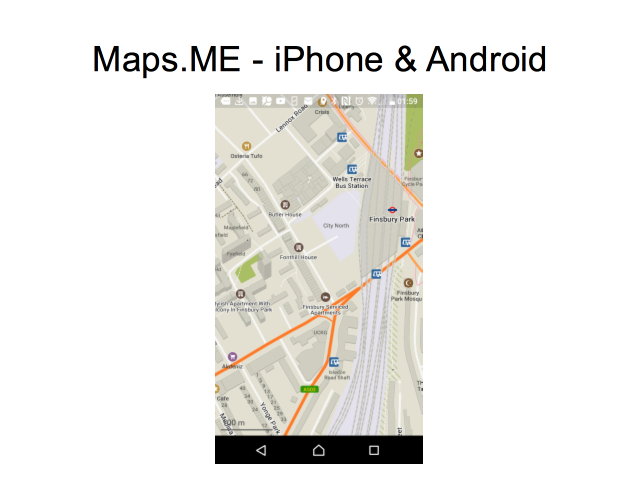
But if I have to make one app recommendation, it would be this: Maps.ME on iPhone and Android is a really great map viewing app. It looks a bit like google maps, so it will feel familiar. But it’s OpenStreetMap! Install it now!
This also lets you download whole countries for use offline, including satnav style routing. It’s great for using without an internet connection while on holiday. But I use it as a really nice useable map view for getting around all the time.
Maps.ME does also have editing functionality. This is an example of a simplified feature-limited editor. You can use it to add a missing shop for example, but only basic edits. It’s not as powerful as Go Map!! or Vespucci.
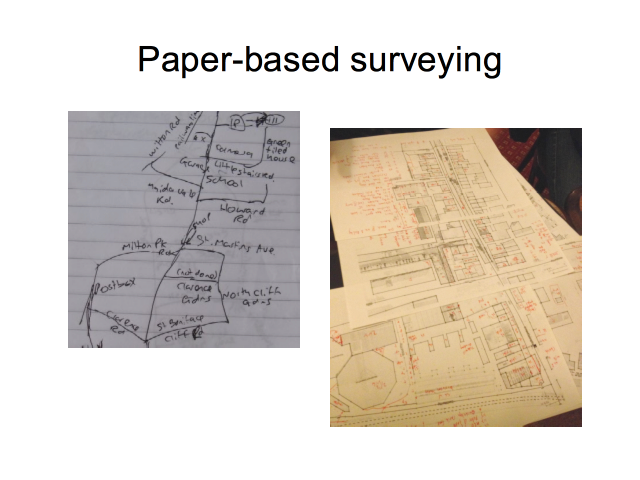
So you can use your gadgets, but I want to stress that gathering data can be as simple as using a pen and paper. Of course you’ll still need to input your data later using JOSM or “id”, but data collection can be very simple and low tech.
…although some people get quite advanced and quite complex with their paper notes!
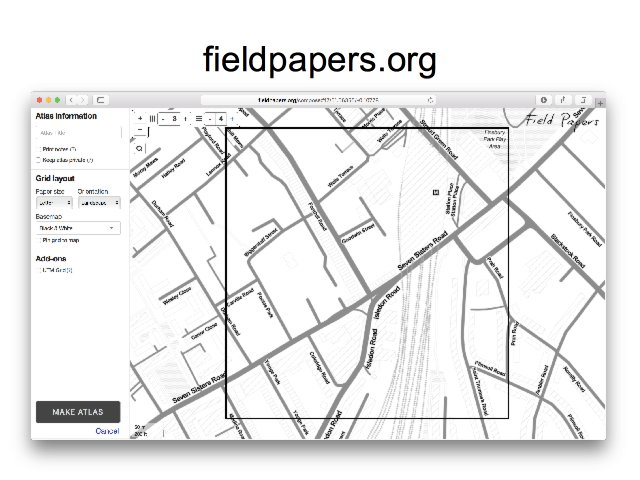
And here’s an interesting tool which bridges the gap: fieldpapers.org
This gives a nice easy way of getting a map printout. It creates an “atlas” of many A4 sheets. Here you see the interface where you’re arranging a grid of A4 sheets to cover an area of interest.
The printouts can then be used for noting down more data which needs to be added to the map. If you want to get clever, these can then be scanned in, and a QR code geolocates the scanned images for use within an editor (but you can easily skip that and… look at the paper!)
Because the data collection is very low-tech pen & paper, this has been used for humanitarian mapping, with local people in Lubumbashi writing down things like street names, and then the paper brought back to London, where we input the data at a fun mapping event.
Speaking of humanitarian mapping (this is a whole other area I didn’t go into) check out the “Humanitarian OpenStreetMap Team”, and a project called “Missing Maps” which is having very popular events every month here in London.
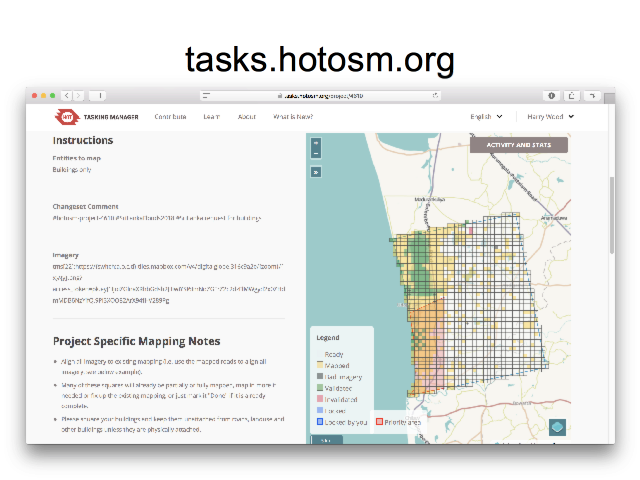
But this is a tool we use to coordinate mapping a lot. The “Tasking Manager” at tasks.hotosm.org. You can see the idea. We divide up an area into a grid. The yellow squares have already been done, and you can acquire a square to work on. It’s a coordination tool which means we don’t accidentally work on the same area even if we have a large number of people mapping.
This is for remote “armchair mapping” where we can sit at home with our laptops and contribute using aerial imagery, to draw around buildings for example.
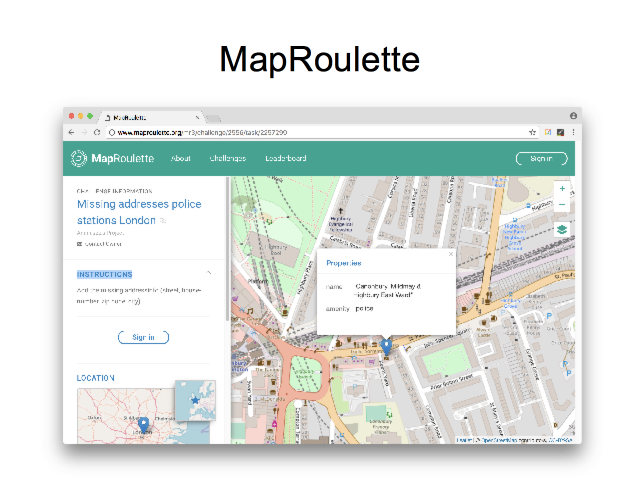
Getting more towards “gamification” side of things, this is a tool called “MapRoulette”. It assigns random little tasks for you to work on (by making edits in the OpenStreetMap data)
Often the “challenges” are created based on data from external sources. Here for example it’s showing Police stations in London, where we could be adding some address data, taking the addresses from some government dataset. So we spin the roulette wheel, and we’re shown a random London police station, and we click to add the address data and then go again!
I wanted to show you a couple of really simple ways of helping OpenStreetMap which don’t involve learning how to edit.
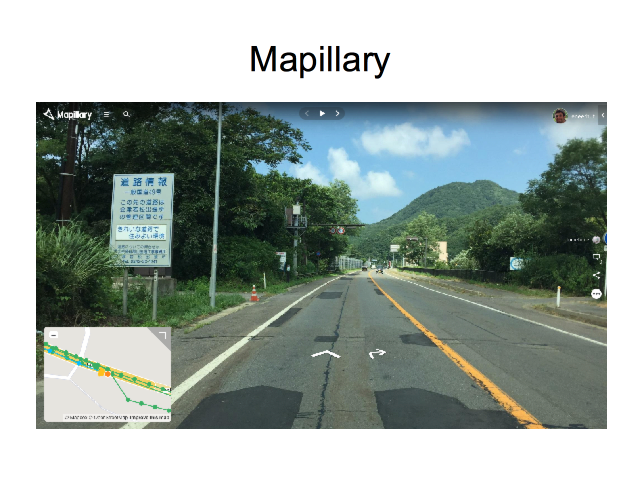
Mapillary is a thing you can contribute to, particularly if you drive a lot. You simply set your phone going taking photos as you drive, and these form a thing a bit like Google StreetView.
But Mapillary works very closely with OpenStreetMap, and allow us to use the images while editing. If we gather enough of these street-level images, it becomes a very powerful supportive tool for OpenStreetMappers. We can easily use it to double-check our data and directly add things like missing shops.
The app is really easy to use because contributing is very passive. You just sort of set it going, and you can almost forget about it. Later you upload lots of photos.
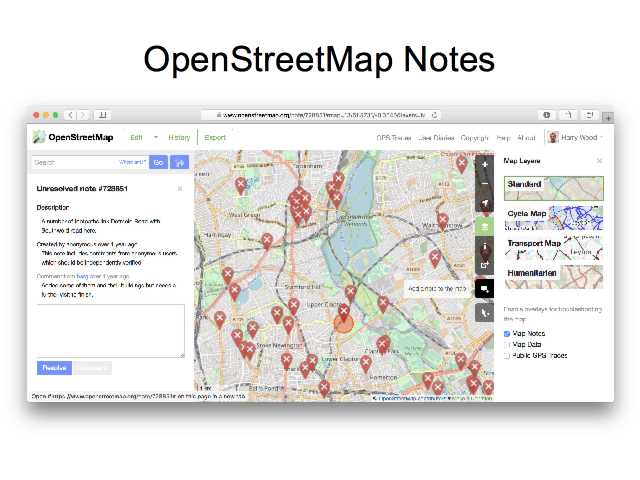
Finally this is perhaps the simplest way to contribute OpenStreetMap: A thing we call “Notes”. Just go to the website and click this button here to add a note. Place a marker and write a textual description of a thing which is missing or needs to be changed on the map. Easy! It doesn’t even require you to log in.
Like Mapillary this is a slightly indirect way of helping. It still requires people who know how to edit, to then go and make use of this information to edit the map.
But this is very much designed to be a very simple way to contribute. It’s dead easy, although do make sure you zoom in and place the marker precisely, and be as descriptive as you can in the text.
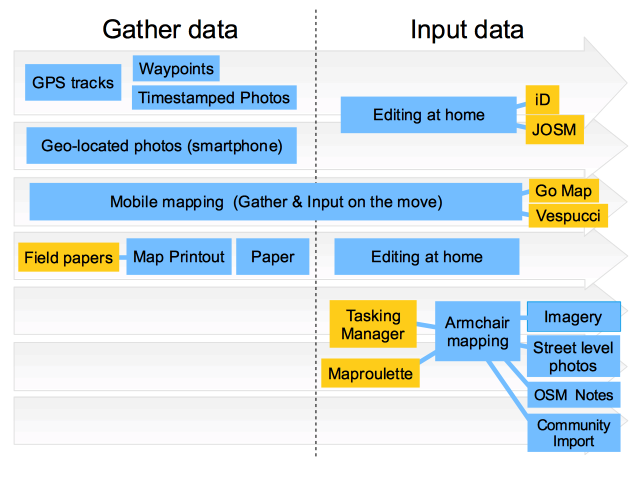
Here’s a summary diagram showing different ways of contributing.
It’s split into “gathering data” and “inputting data”, because often we do things in those separate stages. The mobile mapping approach using Go Map!! or Vespucci will cut across these, because you can make the edit directly while you are out and about seeing things to add. This is perhaps not as useful as it sounds because, tapping away with your finger to add all of data is very slow. If you’re adding lots of things, or even if you’re casually doing some fly-by mapping, I tend to prefer a two stage approach. I snap quick photos on my phone (which are geo-located), and then later at home I view these with JOSM to add the data.
We also talked about Tasking Manager & MapRoulette. These options at the bottom only involve a data input phase without the need for data gathering. But as with the other projects we’ve heard about this evening, OpenStreetMap is a great excuse to go out and look at the world! If you like that sort of thing, you may prefer these other modes of contribution.
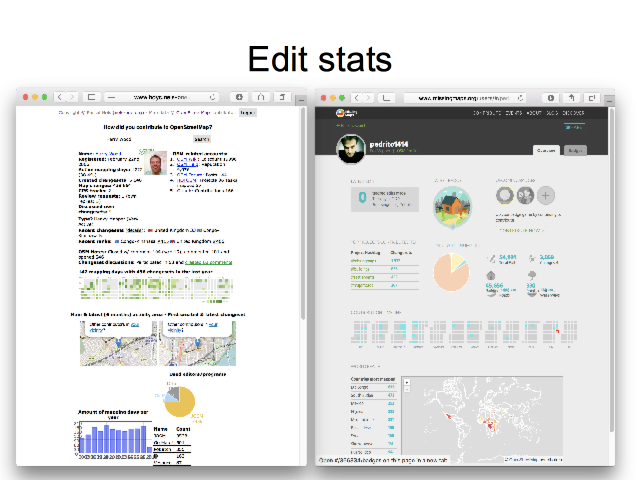
Beyond editing tools, we also have a few tools like this which show us stats on our OpenStreetMap editing. This helps make editing fun and engaging, and naturally a little competitive! This is “how did you contribute?”, and on the right a tool on MissingMaps.org which shows edit stats related to humanitarian mapping with the tasking manager.
I gave a talk at State Of the Map 2017, the official OpenStreetMap annual conference, which took place in Japan last month.
“The Diagrams of OpenStreetMap” is a tour of a various diagrams illustrating the project, but focussing more on my own diagramming efforts, including quite a few new diagrams I produced especially for this talk.
I would have mentioned in my talk, but I wasn’t going public with it at the time: I’m going to be available for new work opportunities soon. Maybe I can find something map related? We shall see (suggestions welcome). In any case I’ve been involved in OpenStreetMap, mostly as a volunteer, for over a decade now, and so I’m well placed to try to capture some “big picture” overviews of the project… in diagram form! That’s what I’ve tried to do here.
But the following are slides and transcript as one big long blog post. In total there’s a whopping 61 slides (I was talking through them quite quickly). I’ve skipped over some animation step slides to reduce this down a bit, but still a lots of slides:
I made a tool to scratch an itch I’ve been having recently. I wanted to see OpenStreetMap notes within the Organic Maps app, so I made a thing to fetch and generate…
This let’s you grab all the notes in an area and download them as KML. Such a download might be useful for various things, but mostly the idea is to easily load notes into Organic Maps
It works nicely if…
(A) you have the Organic Maps app on your phone, and…
(B) you open the above link on your phone (Or this QRcode)
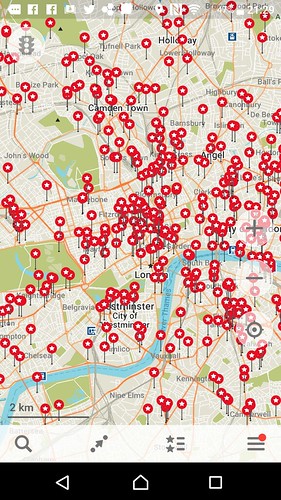
The KML download will (after some confirmation prompts) be handled by the Organic Maps app, and the result is… a shed-load of red bookmark icons:
It will fetch up to a limit of 1000 notes for an area of your choosing, appearing as a layer of “bookmarks” which you can show and hide (third icon on the bottom there).
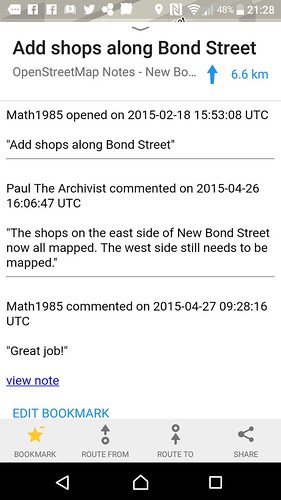
On a bookmark, swipe up to see the detailed description and you get the full note description plus any other comments people have added:
I have control over how that gets formatted, so it’s something I could tweak/improve
What is Organic Maps?
It’s an app which you can install for iPhone or for Android for viewing maps …specifically OpenStreetMap, but it’s worth having even if you’re not a big OpenStreetMap enthusiast, as an alternative to the “maps” app on your phone. You might use it occasionally e.g. when the maps app doesn’t have the detail you want. Organic Maps requires an initial (quite big) download of an area, and then it all works offline. Great for going on holiday somewhere.
(You may have noticed I previously talked about MAPS.ME on here. Organic Maps is basically the same app, but it was newly created as a proper open source project involving some of the original developers of MAPS.ME after that app got sold off. A complicated story)
What are “notes”?
OpenStreetMap Notes allow people (anyone. without even logging in) to report a map problem or an omission on OpenStreetMap. So if you don’t fancy learning how to edit OpenStreetMap (we try to make it very easy, but …takes a bit of learning) then instead you can effectively ask somebody else to make the edit, by simply leaving a note. However it’s important to position the note precisely, and add as much description as you can. Preferably even link a photo of the thing which is missing/wrong.
As a mapper you will understand the importance of this when you come to try to clear out the open notes in an area. In London it feels like most notes are pretty unclear and poorly described, but of course we’re generally only looking at the notes which are left open. It’s quite common for somebody to write just a few words, seemingly reporting the name of a missing thing, but if that’s the level of effort somebody is willing to go to (not even constructing a sentence) then the data doesn’t feel reliable enough to do anything with, other than to leave open and go survey. And there’s various other types of notes which lead to this same conclusion. Going to take a look on-the-ground is going to be the way to solve the note.
And going to look on-the-ground is really the idea behind this. Because I use Organic Maps a lot while out and about, for everyday navigation, I’m hoping having the notes in there will help remind me to go take a look
I described some reasons to switch to HTTPS on my website. To be completely honest though, I didn’t finally get off my ass do that for any of those good reasons. I did it because I was building a map thing which requested browser geolocation and I noticed geolocation stopped working in chrome.
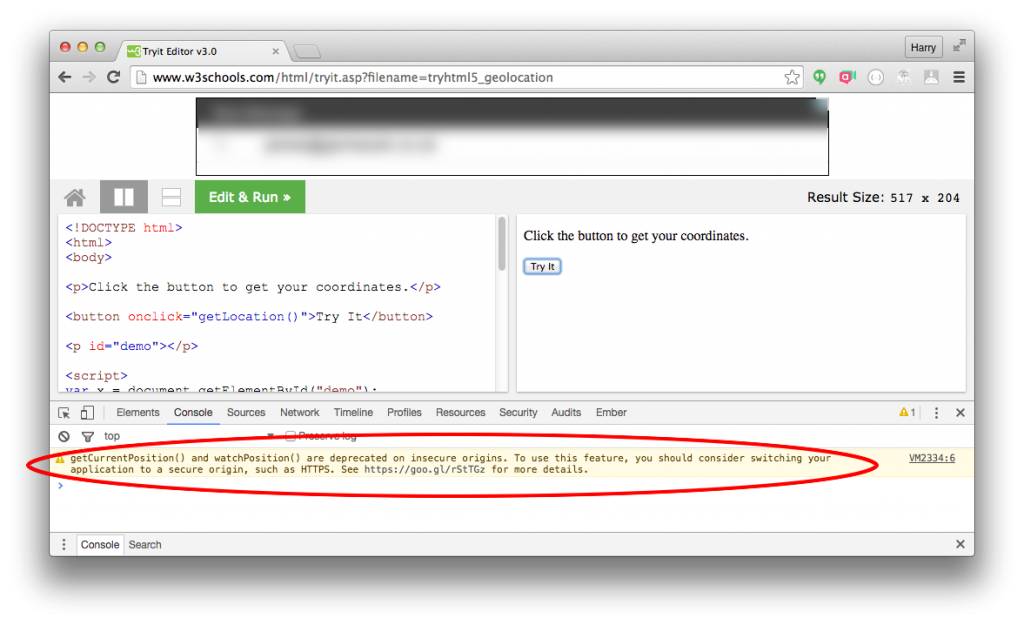
I’ve seen this deprecation warning a few times:
“getCurrentPosition() and watchPosition() are deprecated on insecure origins. To use this feature, you should consider switching your application to a secure origin, such as HTTPS. See https://goo.gl/rStTGz for more details.”
But somehow didn’t take it seriously. But yes. New versions of chrome won’t do geolocation unless it’s a HTTPS site. See this for yourself with this very basic geolocation test page on w3schools (which is http). [Update: Originally this was http, and so didn’t work in chrome. w3schools have since gone https]
The javascript console still only shows it as a deprecation warning not an error, but if your web application was relying on this… it broke.
(Update for Aug 2017) Firefox v55 is going with this lock-down too. It says “Geolocation error: User denied geolocation prompt” as a popup, and in the console “A Geolocation request can only be fulfilled in a secure context.”
Any sensible application should probably be watching out for failure cases with geolocation anyway (see later examples for handling errors), but even so I find it a bit surprising that any old websites using geolocation across the web will be broken. There’s a bit more info on this google developers page
If you use LeafletJS, there’s a map.locate method which presumably uses the same method internally (navigator.geolocation.getCurrentPosition), but leaflet also detects the Chrome failure and pops up a different error message…
Recently we celebrated one year of “Missing Maps” events. These humanitarian OpenStreetMap mapathon events have been very successful, packing out venues in London every time, with enthusiastic new mappers, who bring their laptops and perform remote armchair mapping of far off lands.
We’re successful at getting new mappers involved, and as we teach them, we drive up the quality of the basic data, and also help some of them to become quite advanced mappers (only some. That’s the long tail curve after all)
Meanwhile the OSMLondon pub meet-ups remain successful too in their own way. I’ve been organising them for years. Going back through the history of OpenStreetMap we’ve always had our merry band of OpenStreetMappers meeting in pubs, and doing London mapping.
I’m very keen to promote more cross-over. These newly recruited humanitarian mappers are yet learn about the joy of on-the-ground survey-based mapping. Mapping your own neighbourhood is the OpenStreetMap way. It seems like a vital missing piece of the puzzle really, if these new mappers are to truly integrate and be a part of the OpenStreetMap community.
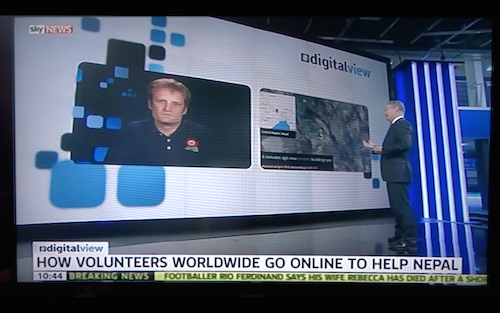
Yesterday I appeared on Sky News giving a short interview about the Humanitarian OpenStreetMap Team response to the Nepal earthquake. This was part of a news tech show called “#Digitalview”, aired at 10:30 (just in the UK I think).
Note: I hope sky news don’t mind me sharing this video clip here for the moment. I think they may publish the whole show at better quality at some point. I’ll swap in a link to that if/when I see it.
At the Open Data Institute, the office where I’m working at transportAPI these days, they have “Friday Lunchtime Lectures“. Presentations on all sorts of open data topics. It was my honour to kick off the 2014 series with a talk on “Typhoon Crisis Mapping with OpenStreetMap”.
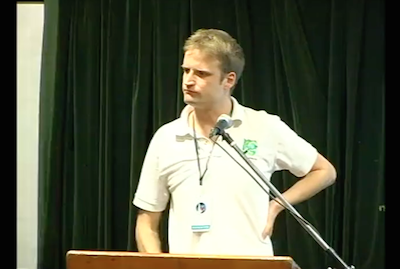
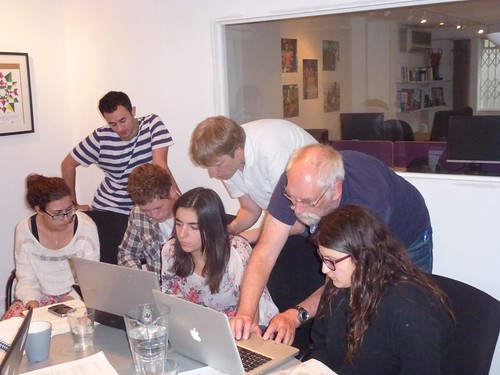
A week ago I got together with Steve Chilton and Steven Feldman and gave an OpenStreetMap training course to a handful of enthusiastic young people who were about to head out to Ghana as volunteers with a charity called tzedek.
I’ve done similar things before but nothing exactly termed a “training course” actually. It was pretty similar to the UCL Masters Student mapping party Sept 2010. Back then I was asked to kick things off with an introduction, and had to stand up and make something up on the spot. This time I had some slides prepared.
Which slides? Well maybe I should’ve just used learnosm.org teaching resources for this. I took a look at them, but I decided I wanted to say a bit more in the intro sessions (perhaps wrongly actually). The learnosm.org slides are Continue reading “An OpenStreetMap training course intro”→